AI Faculty Supports in Blackboard Ultra
Course Analytics
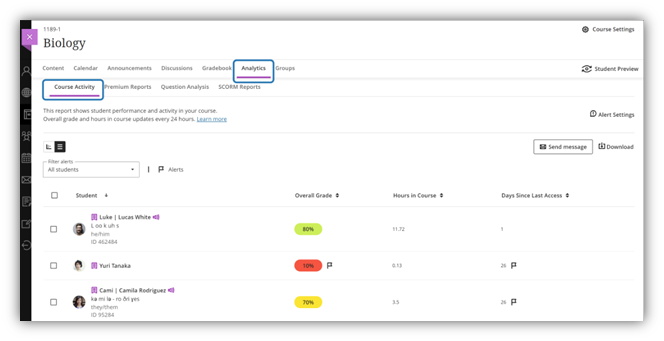
The Course Activity report is a valuable tool for gauging your students’ engagement in your course. It’s accessible to all roles with grade viewing privileges. To maximize the benefits of this report, activate the Overall Grade feature. Here’s what you can do with it:
- Detect students who may be struggling by examining their overall grade, course activity duration, and time since their last login.
- Reach out to students who are falling behind, offering encouragement to increase their participation.
- Acknowledge and applaud high-performing students, potentially inviting them to act as mentors.
- Tailor your course alerts to pinpoint struggling students when their overall grade drops below a specific threshold or when they’ve been inactive for a designated period.
- Export the table view data to a CSV file for in-depth analysis using other tools.
- Save the scatter plot as a PDF or image, facilitating easy sharing of information with fellow instructors or course mentors.
To access the Course Activity report, go to the Analytics tab


After students have started engaging in the course, you will see data begin to populate in the table.
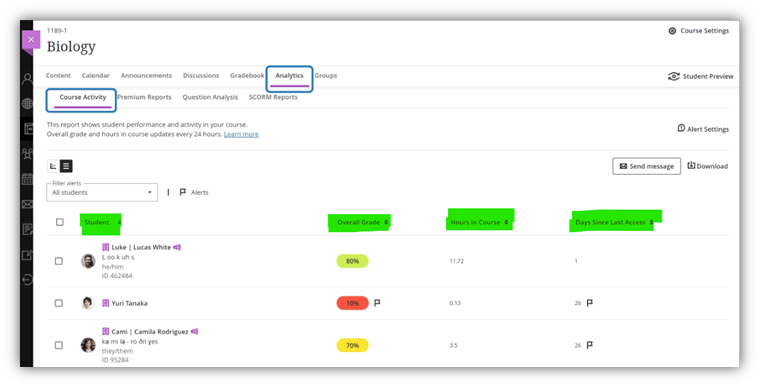
The table has four columns:
- Student: Student’s first and last name. Additional student information is shown if available: accommodations, additional name, name pronunciation recording, pronunciation description, pronouns, and Student ID.
- Overall Grade: A student’s overall grade in the course. If the overall grade column is not turned on or if there is no graded material, this column won’t display information. This column is updated every 24 hours in the early morning, so the overall grade in the report might not match what is currently in the Gradebook.
- Hours in Course: Number of hours a student has been active in your course. Hours in course are counted from the time students select something within the course to when students select something outside the course. If a student is logged out from their course session, only the time before their last action within the course is counted. This column is updated every 24 hours in the early morning.
- Days of Inactivity: Counts the days since a student last accessed a course. Each time a student accesses the course, the count of days of inactivity changes to 0.
Each point on the chart represents an individual student, and there is a correlation between students who spend more time in the course and those who tend to earn higher grades. Here are some actions you can take with this chart:
- You can zoom in or out using the “+” and “-” icons located in the upper right corner of the chart. To focus on a specific area, simply click on a point on the chart and drag to zoom in.
- This chart allows you to identify visually unusual patterns, such as students with low grades who are investing significant time in the course or high-achieving students.
- By selecting a specific point on the chart, you can view details about the student, including their name, overall grade, time spent in the course, days of inactivity, and any associated alerts. The time spent in the course is measured from when a student interacts with course content to when they exit the course. If a student logs out during their session, only the time until their last action within the course is counted.
- Purple points indicate students with at least one alert. Additional information about the alerts specific to a student can be found in the alerts section.
- You have the option to access a detailed student activity report by selecting “View Details.” This report provides a weekly breakdown of the student’s progress. For more information, refer to the “Student Activity Details Report” topic.
- Finally, you can download the scatter plot as either a PDF or image file by clicking the “Download” button. This allows you to easily share the scatter plot with other instructors, academic staff, or course mentors.


- You can adjust alerts in the Student Performance section of the Gradebook settings. Open the settings panel by selecting the Settings button at the top of the Gradebook.
- You’ll receive activity stream notifications based on your settings:
- If a student hasn’t accessed the course in a certain number of days. Alerts for inactivity are set to five days of student inactivity by default, but you can adjust alerts for each course.
- When a student’s overall grade drops below a certain percentage. Alerts for overall grade percentage do not have default settings.
Design Assistant

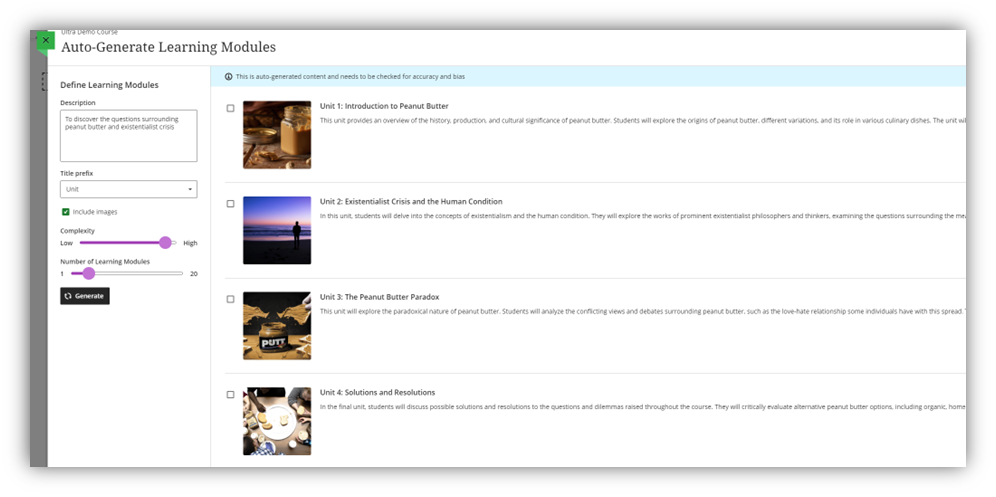
Course Creation: The AI Design Assistant can act as a springboard, suggesting the organization of a course, including module titles, descriptions, and images, all based on the course content. This allows instructors to focus on their expertise – teaching.
Keep in mind: the idea isn’t that AI will provide end-to-end course design. It’s a resource that can inspire you – the expert – to recognize how to extend or fill in the gaps. Much like participating in a design workshop with peers, you’ll often gain insight from discovering what does not apply to your course(s).
Modules are shaped by the description you provide, the complexity level, number, and title – unit, topic, week, chapter.

Content-based Test Creation: AI-driven algorithms examine the content of a document and swiftly produce a wide range of questions. Instructors can then review and modify these questions.

Rubric Creation: Rubrics only have one downside – the time it takes to produce them. Design Assistant will formulate a rubric based on specific assignment content.

Royalty-free Image Sourcing: The AI Design Assistant offers image suggestions that are free from royalty concerns, aligning them with the course or document’s context. This eliminates the need for tedious searches for compelling visuals to enhance course materials and alleviates concerns about potential copyright violations.
