M.U. Confocal Facility
.
 |
||||
M.U. Confocal Facility |
||||
. |
| .
|
|||||||||
|
 |
||||||||
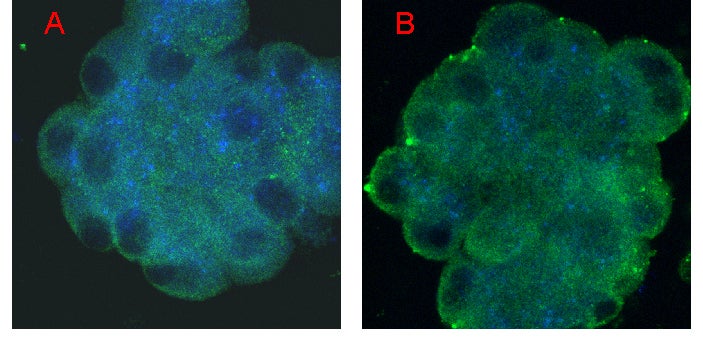
| Glucose-induced insulin release from calbindin-D28k KO islets. KO islets incubated in 5.5 mM glucose were exposed to 30 mM glucose and the confocal images were acquired exactly as described in legend to the Fig. 2 and 3 (see below) except that the secondary antibody to insulin contained Alexa Fluor 568 as fluorescent probe. The 3-D reconstruct as shown in Panel A in the presence of 5.5 mM glucose indicates an abundance of insulin secretory granules (shown in blue color) and L-type VDCC (shown in green color). In high glucose (Panel B), the 3-D reconstruct clearly shows a decreased level of insulin granules in the KO islet (greatly reduced blue color). | |||||||||
| . | |||||||||
|
|
|
 |
||||||
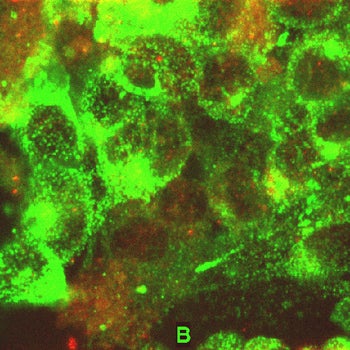
| Glucose-induced redistribution of calbindin-D28k and its co-localization with L-type VDCC in bHC-13 CaBP40 cells. bHC-13 CaBP40 cells were either exposed to 30 mM glucose or remained in 5.5 mM glucose for 20 min and then the reaction was stopped in space and time by adding fixative. The fixed cells were labeled with antibodies directed against L-type VDCC and calbindin-D28k and the secondary antibodies to these proteins contained Alexa Fluor 488 and Alexa Fluor 647 as fluorescent tags. The 3-D reconstruct of confocal images of cells in 5.5 mM glucose (Panel A) indicates L-type VDCC (in green color) abundant in plasma membrane and calbindin-D28k (in red color) primarily located in cytoplasm suggesting almost no co-localization of these proteins. In 30 mM glucose, the 3-D reconstruct (Panel B) exhibits several areas of co-localization of these two proteins as shown by the appearance of yellow color (green + red = yellow). The height of the image stack is 10 mm. Each section in the stack was 1 mm. | |||||||||
. |
|||||||||
 |
|||||||||
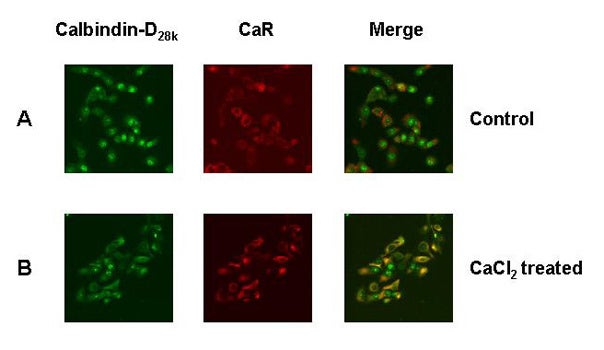
| Co-localization of calbindin-D28k and CaR in 40 mM CaCl2 treated MDBK cells: The 3-D reconstructs of calbindin-D28k (leftmost panels, green color), CaR (middle panels, red color) and merged images (the rightmost panels) are shown for (A) control and (B) 40 mM CaCl2 treated MDBK cells. A comparison of merged images in control versus CaCl2 treated MDBK cells show co-localization of calbindin-D28k and CaR upon CaCl2 treatment (as judged by the appearance of yellow color in the rightmost lower panel). Note, little if any overlap of red and green colors in merged image (rightmost top panel) of control (1.26 mM CaCl2) MDBK cells. | |||||||||
| . | |||||||||
 |
|||||||||
| CaR is primarily located on plasma membrane: The paraformaldehyde fixed MDBK cells were treated first with the primary antibody, anti-CaR (generated in rabbit against a 20 amino acid peptide sequence near the C-terminus of human CaR), and then with Alexa Fluor 568 labeled secondary antibody (anti-rabbit IgG) to reveal the cellular location of CaR. Confocal images of immunofluorescent-labeled MDBK cells show that CaR was localized to the cell surface (red dots.) | |||||||||
|
|||||||||